Schedules are getting better for broadcasters, at the expense of governance

This post was sparked by a tweet from Omar Chaudhuri, regarding changes to Austrian soccer in 2018/19:

Österreich Fußball Bundesliga 2018/19

I thought I should test this assertion, and found it is true for a range of common scenarios, although the trade-offs are considerable. The results of 40 million league simulations are below.

Background: What do professional leagues want?

We are seeing a growing trend of sporting bodies adjusting their schedules to maximise broadcasting revenue. From the NRL leaving its fixture floating so Channel 9 can put the best teams in the prime timeslots, to MLB introducing wildcard playoffs, to cricket ensuring India and Pakistan are always in the same group, there is a substantial buck to be made by tweaking fixtures. Marketing managers are paid extremely well to dream up ideas that spread games across more eyes and grow the sale price for rights.

In many cases, this aligns with the fan who sees more televised sport and the excitement of his/her team being in contention for longer. But deviating from the pure formats of round-robin* or straight knockout brings the risk of what economists call perverse incentives.

We have already had many situations where both teams would be happy to settle for a draw to qualify for the next stage of a tournament at the expense of a third. Even worse is when either team would achieve a better outcome by losing a particular match. This year, Graham Kendell and Liam Lenten published a paper with a collection of farcical cases called When Sports Rules Go Awry in the European Journal of Operational Research. As new formats are brought into national leagues, experts must test them as thoroughly as Durex for any holes that lead to unwanted outcomes. Stress-testing fixtures for potential unwanted outcomes

Let’s be clear: despite exhortations to play your best, if the tournament structure favours a loss it is rational to aim for it. It just feels and looks terrible, so people get disqualified for it after the fact. It behoves sporting bodies to carefully design their tournament formats with this in mind. How do you blame the competitors when it is the governance that failed?

The new Österreich Fußball-Bundesliga format

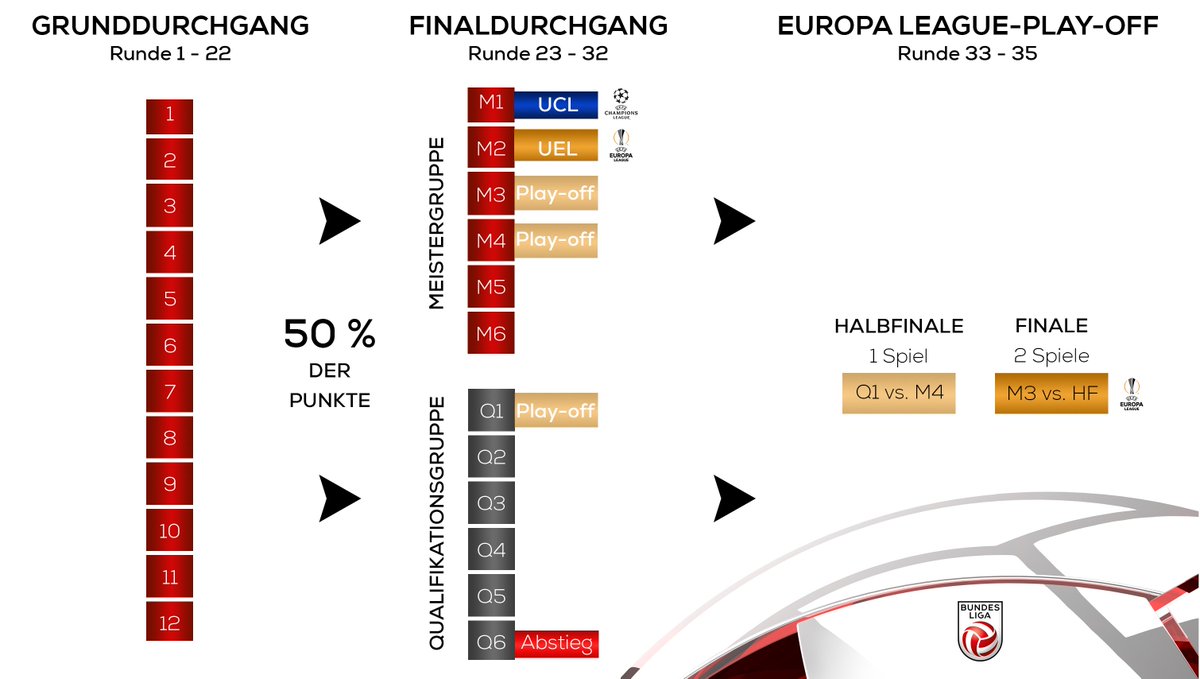
In 2018/19, the top tier of the ÖFBL (Austrian Football League) grows from ten to twelve teams, and in an effort to increase interest for mid-ranked teams the governing body has decided to split them after a double round-robin (Rounds 1-22). Points from those 22 matches will be halved. The top six will then play amongst each other twice, while the bottom six do the same (Rounds 23-32). The twist is that those bottom six remain in contention for a Europa League playoff berth, and all the money that could bring. Even better for the ÖFBL, this creates three end-of-season playoff matches that should attract eyeballs and euros.

The first problem is that Austria is a moderately weak league (ranked 16th in Europe), recently dominated by Red Bull Salzburg (seven of the past ten titles) and the two large Vienna clubs (Austria Wien & Rapid Wien). On current allocations, the league receives just one Champions League ticket, and two† for the lesser Europa League (nominally one into the Second Qualifying Round, and one into the First Qualifying Round).

Under the new system, the team that finishes “seventh” — i.e. best of the lower half (Q1) — will host the team that finishes fourth (M4) in a single playoff. The winner of that will play home & away against the third-placed team (M3) for the last Euro spot.

The ÖFBL did receive outside help to construct and test its new system from Hypercube, based in the Netherlands, who have also consulted to other national leagues.

Benefits

  • Teams in the bottom half are playing for something until later in the season
  • More matches between two good teams
  • More projected revenue from attendance and rights (I assume)
  • As a whole, there is still a sensible payoff structure with respect to the strength of each team, compared to round-robin
  • Halving the points means that later games matter more, freshening the incentive
  • The single playoff hosted by the best of the bottom half will often be a 50/50 game, as the home ground advantage cancels out the skill advantage of the fourth-placed team

This is not repechage

Repechage is a very appealing concept from a tournament design point of view. If you have an initial short classification stage, sometimes good competitors will fail to win through just by luck. Giving them a (tough) route to remain in contention for the trophy can be an excellent way to maintain interest while keeping the payoffs fair and incentives clear. I’ll revisit my 2010 World Cup proposal some time soon, as an example.

I would not call the ÖFBL proposal repechage. The teams have a full double round-robin, which will usually provide enough resolution to the order. The number of cases where team 7 is actually better than team 5 (or 4) starts to diminish. Why give them a leg up?

On the flipside, team 7 is now excluded from winning the title or indeed finishing in the top three. A top team that somehow found itself 7th after two round-robins would have made the top three 40% of the time after the addition of a third full round-robin.

Methodology

To simulate the plan, I had to generate plausible team strengths and compare the ÖFBL schedule with the alternative. The current ten-team league has a quadruple round-robin of 36 matches, impossible with 12 teams. So I went for a triple round-robin over 33 rounds as the comparison, alternating the extra home game from simulation to simulation. I did not halve the first-stage points in this scenario.

Team strengths were drawn from a Skew Normal Distribution, which can mimic a situation where you have the upper tail of a natural (Normal) distribution with a mask (Normal CDF) indicating that lesser teams have been relegated or otherwise sit in a lower division. I used the observed average home (1.58) and away (1.30) goals to fit the distribution, and checked that the simulated results (via Poisson random variates, Mersenne Twister algorithm) passed the sniff test for how often the top teams won.

Each set of random team strengths was used for 1000 simulated leagues, then a new bunch was drawn. In each set, the team with the highest strength was labelled A, the next highest B, all the way down to the weakest team L. 20,000 different sets were used for each type of fixture, meaning 20,000,000 full simulations of each type.

What went wrong?

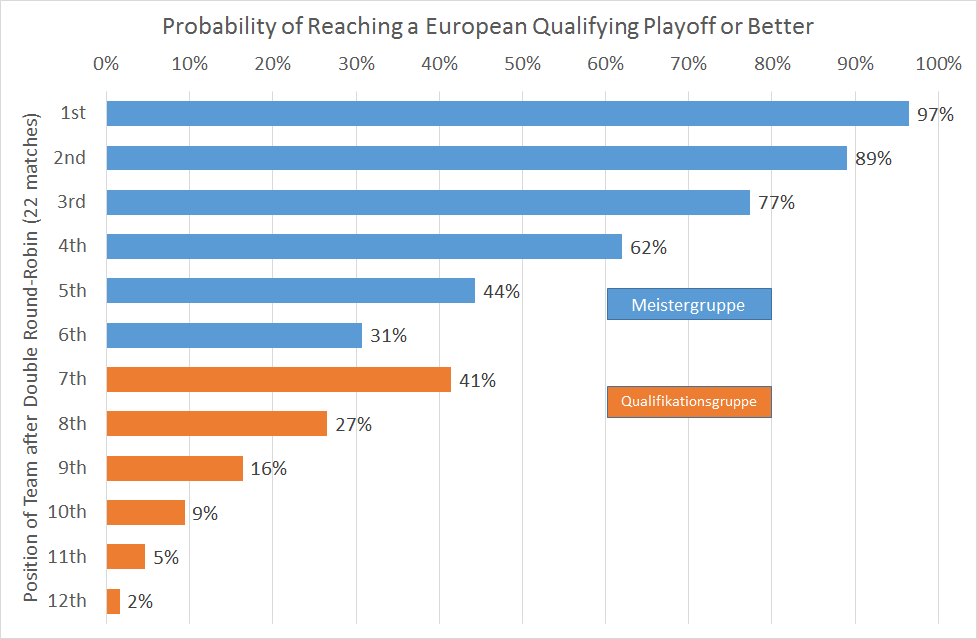
This is the plainest way to see the thing that makes people uneasy: team 7 has a higher chance of reaching a playoff than team 6. In fact, it’s nearly as high as the chances of team 5. Post-season (as the Americans like to call it) is a clear marker of success, and the team that misses the elite group cut is better placed to achieve it.

But let’s consider the value of these playoff positions in terms of the likelihood of reaching the money rounds in Europe. Q1 will play M4, the winner of that playing M3 for the Europa League position. That position will be the lowest ranked of the Austrian Europa teams, and play in the 1st or 2nd Qualifying Round, needing a few wins over European rivals of similar strength to make the richer group stages. Meanwhile, M2 is in the 2nd Qualifying Round at least. Of course, the champion M1 has a Champions League chance, worth even more.

Let’s make simple metric that says a Champions League berth is worth 8 points, double that of the Europa League: 4 points. Reaching the ÖFBL two-legged playoff is then worth 2 points, and the Q1 vs M4 match-up is worth 1 point to each competitor. The next graph shows the average value for a team in each position after Round 22.

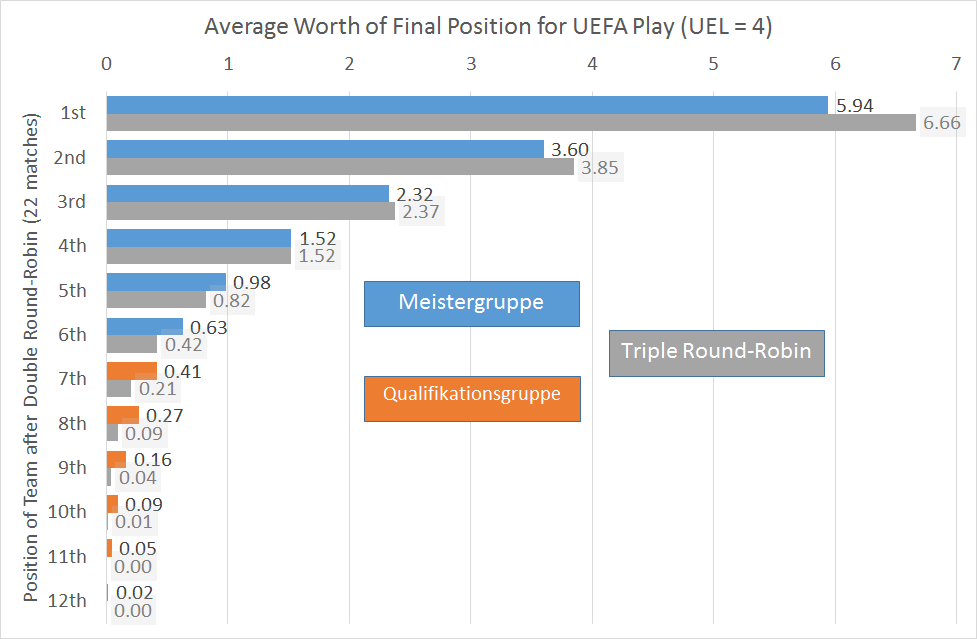
The design looks to have achieved what it set out to do: a smooth decrease in the value of the position after Round 22. The team that has dominated the first two-thirds of the season is going to have to work harder as its earned points are halved, and there is more chance of the bottom eight moving into contention as planned.

Looking at teams labelled A because their intrinsic strength was the highest of the 12 teams, they win the trophy 59% of the time under the ÖFBL model and 60% under 3RR. In fact after 20,000,000 league simulations of each type, the profile of each labelled team finishing in each position is so similar as to make no difference. The Meistergruppe double round-robin does a decent job of bringing the cream to the top. There are quirks: for instance, the sixth-strongest team F‘s most likely final position is not M6 (14.6%), but the positions on either side: M5 (14.7%) or Q1 (14.7%). Nothing too serious.

Now, like the Durex factory workers, we’re going to do some stress-testing. Does this new model work well for every team and scenario, or just on average?

6th after Round 22 7th after Round 22
Playoff or better Avg Metric Playoff or better Avg Metric
Σ 31% 0.63 41% 0.41
A 74% 2.60 75% 0.75
B 65% 1.73 69% 0.69
C 55% 1.21 64% 0.64
D 44% 0.87 59% 0.59
E 34% 0.64 54% 0.54
F 27% 0.486 49% 0.490
G 22% 0.39 43% 0.43
H 19% 0.32 34% 0.34
I 16% 0.26 27% 0.27
J 13% 0.21 21% 0.21
K 10% 0.16 16% 0.16
L 8% 0.11 11% 0.11

As we established earlier, the average 6th-placed team has less chance (31%) of making the Austrian playoffs than the average 7th-placed team (41%), but the net value of their playoff position will be greater (0.63 vs 0.41). For strong teams, there are clear benefits in finishing in the top half and competing for the top three. The trouble comes with teams F, G, H, & I: in each case, not only is the chance of a playoff nearly doubled by dropping into the bottom half, but the simple metric we calculated shows they have a slight benefit in doing so.

In other words, for the teams that are most likely to be on the cusp of qualification, it is better to play ten matches against weak opponents and hope for Q1 than play ten matches against strong opponents attempting to land in M4 or higher. If the team is a long way behind the top four on points, it has extra incentive to tank. The only clear reason for aiming for 6 over 7 would be if a strong team or two has accidentally underperformed into the bottom half.

We predict teams with sufficient mathematical nous will be confronted with this scenario some time in the next few seasons, and the ÖFBL’s governance will come under heavy fire. Nice try, it just needs a tweak before that happens.


* Round-robin can still have opponents with differing enthusiasm for a win, especially with potential draft order at stake. It’s possible that an equivalent of the Condorcet Paradox or even Arrow’s Impossibility Theorem exists in fixturing: if there are competing priorities, there may be no system that eliminates perverse incentives in some circumstances, and all we can do is lessen them.

† There are three Europa League slots, but one is given to the Austrian Cup winner. Also, if Austria climbs to 15th in the UEFA coefficient, it will gain a second Champions League berth. This makes qualification from fifth (M5) possible, which would imply 6 is preferable to 7 in all cases.

Should tennis players strive to serve fewer points?

Last month Craig O’Shannessy published an article about how the top players on the ATP Tour play more points served by their opponents than on their own serve. The article claims that the best and most experienced players are more efficient with their serve and developing players should strive to emulate that.

A conversation with Damien Saunder around how a coach should react to this article, and this sort of advice in general, got me thinking.

I have a lot of respect for O’Shannessy (no relation) in general, and he is regarded as the ATP’s stats guru with a terrific track record of popularising the available data. But this article displays the very common fallacy of mistaking effect for cause, something that leads many coaches to chase wild geese.

Let’s establish the facts first, from some basic mathematics. A top player generally wins tennis matches because he wins more points than his opponent (modulo nesting). As players alternate serve, this is equivalent* to saying that he wins a higher percentage of points on his serve than his opponent does in the opponent’s service games.

The other thing that elite men’s tennis has is a serve advantage. Players tend to win about 64% of their points on serve against opponents of similar strength, which leads to about 81% of service games won, broadly compatible with an independent and identically distributed IID† points assumption. This varies by surface and individual style.

This means that inferior players have winning point percentages on serve closer to 50% than their opponents. This naturally leads to more close games. And closer games under the rules of tennis have more points as they go to deuce and a situation where either player needs to win by two points. Thus, the inferior player has to serve more points. No magic mental games required.

Have a look at the outliers in the article. Wawrinka is low because his ranking is inflated from the U.S. Open win and his overall point winning ratio is not as good as the others in the Top 10. The young players mentioned in the article like Kyrgios and Pouille are also low, because the 20-month sample period includes a time when they were even younger and not top 20 quality. Federer is high because his injury has prevented him earning points; when he was on the court he was elite. In other words, there is a tight correlation between the basic percentage of points won and this new statistic.

Imagine a different sport — like volleyball — where the team on serve has a distinct disadvantage at elite level. If the scoring system was like tennis, you would see the best teams play more points on their serve just because they are the more competitive situations. It’s nothing to do with trying to keep the pressure on their opponents, it’s just a result of the scoring system.

The lesson I would take from this case study is to consciously distance yourself from analysing minute variations in outcomes. It can get to be like reading tea leaves. You cannot coach an outcome, only adaptive processes that produce the ones you want more often than not. Don’t try to coach the KPI as making your opponent’s service games longer, glance at it as an imperfect indicator of a better player.


* It’s arguable that I’m defining the statistic out of existence here, so let’s look at an extreme example. Imagine a typical close match of 150 points, where Player A wins 63% of points on serve compared to Player B’s 60% on his serve. If they had served 75 points each (50%/50%), A would have won 47 points on serve and 30 on return. That’s 77 points to 73. If B had played longer service games, let’s say 84 points to 66 on A’s serve, that’s a massive 56%/44% split of service activity which is well beyond the bounds of the data O’Shannessy showed. It’s like one player averaging 7 points per service game (plenty of deuces) compared to 5½ per service game (win to 15 or 30). It’s almost physically impossible to get that discrepancy with this mix of service point win percentages. Yet Player A would still have won 75 points, a reduction of only two. The point is: a basic stochastic process with service win% as the only input (pair) explains all the variation in outcomes.

† While the IID assumption makes for an easy modelling process, with enough data we see that players don’t follow it exactly throughout matches and there is more autocorrelation than a truly random process. That effect of a combination of mental & physical performance is for another post.

Statistician vs Analyst Conversation

A lot of people want to get into the sports analytics industry, but it’s a long row to hoe from a traditional training in statistics to being a productive member of a sporting club. Employment paths for statisticians and data scientists traditionally cover careers like finance, medical research, and marketing. Sports data is different: a lot of it comes from adversarial situations with continual adjustment of environment. A successful path involves a complex network of players, coaches, sports scientists, opponents, plans and counter-plans.

Here’s the type of conversation that I hear between beginner sports statisticians (S) and experienced analysts / coaches (C). We all have to learn about the importance of context.

S: We’ve had a pretty good season, but our pass completion rate is in the bottom 20% of teams. I’ve done a regression and if we just improved that stat by 2% we would be the best team in the league.
C: Let me have a look at that data. Being a good team means that we play less in our defensive half, where it’s easier to complete a pass. If you adjust for that, I bet we look better.
S next day: OK, that made some difference. But when I isolate just passes in our defensive zone, we’re still below average. In midfield we’re well below average for passes that find a target. We have to fix this!
C: But we encourage our players to take risks. As long as they are making good decisions about the type of pass that might lose possession, we come out ahead despite the raw success ratio being low. Have a look at whether our completed midfield passes lead to more attacks.
S next week: it took a while but I filtered down to just our successful midfield passes. We’re still only a touch above average using a metric of goals per chain from a completed midfield pass.
C: Did you correct for expected goals?
S: Huh?
C: We’re getting to a smaller sample if you’re looking at just goals. Get a more reliable measure of attacking quality by looking at the expected number of goals from those opportunities.
S next fortnight: YOU WERE WRONG OLD MAN! I adapted an Expected Goals formula for our data and we get about the number we expected. We MUST complete more passes coming through midfield to set up goals.
C: What did you do with the turnover data?
S: We already know we’re turning over too many passes, stop changing the subject.
C: I mean, what happens to the ball when we don’t complete the pass? It goes into dispute, or the opponent gets clean possession. Have a look at those chains of play.
S mutters under breath
S next month: Hey I’ve got something interesting. Did you know that when we lose the ball passing forward in midfield, our opponents hardly ever score on the counter-attack? Our equity* from those plays is the best in the league.
C: Yeah, makes sense. We’ve designed our offensive structure with men covering the most productive routes out of defence, and we train them to anticipate the turnover. We don’t over-commit to speculative attacks.
S: Why didn’t you just say that two months ago? Oh wait … how do I categorise defensive structures from our crappy tracking data?
C: Now you’re thinking like an analyst, not just a statistician.

* Equity = net expected score from the situation. Adopted from backgammon theory

DFL-Δ3 JV is hiring

The Deutsche Fußball Liga (DFL / German Football League) has entered into a joint venture with sports data producer deltratre to service the German professional soccer industry. The JV — Sportec Solutions GmbH — headquartered in Köln (Cologne) is now hiring, and the job descriptions give some idea of how much of a landmark this enterprise could be. See the positions under the Sportec heading.

I’ve had the opportunity to speak with Dr Daniel Link at conferences over the past few years. Daniel is a serious researcher (in that very German way) who is also responsible for writing and maintaining the documents that describe how data should be recorded in soccer. These are official documents of the DFL that each data provider must follow in order to provide consistent definitions of Zweikämpfe (duels / one-on-one contests), Torversuche (goal attempts), and everything else you want to observe about performance in the sport.

It is no accident that Germany won its fourth World Cup in Brazil 2014. The culture of analysing football in Germany would be foreign to most other national sporting organisations, based on evidence and theories of the game that are both well-tested and innovative. In some professional clubs here, I am seeing the same type of culture leading to success. It’s not so much the data methodology or analytical techniques that matter, it’s about being able to question practices and approach the answers with confidence that the majority of coaches are open to having a dialogue about evidence and its meanings.

If you’re interested in moving to Köln, I would highly recommend these opportunities. Although it would be a distinct advantage to speak or at least read German, it is not required.

Here’s a translation of some of the key points in each job:

Director Operations & IT
In your kit-bag, you have a degree in computer science or engineering and operational expert knowledge in sports media or a club environment
Head of IT Entwicklung (Development)
Manage the IT Development department using agile methods; be the “champion” of IT issues; experience in real-time databases
Manager Tracking
Responsible for the management of “tracking” for the DFL, i.e. collection, validation, and processing of position tracking data
(Senior) Produkt Manager
Both customer-facing, and responsible for design and specification of products and projects
IT Operations Manager
This one is less about football specifically: manage the entire IT infrastructure including live delivery

I’d also encourage other sporting leagues to take their data responsibilities in-house the way the DFL has, and resource it properly. The data analytics community is watching!

The 17-D-4 AFL Fixture

A full 17-match Round Robin. A guaranteed return Derby match in Round 18. Then four matches to complete the schedule, carefully chosen to achieve a proper handicap. What’s not to like?

What Does 17-D-4 Do Better than the Alternatives?

Alternative 17-D-4
Current Fixture
Return matches based on last year’s ladder Return matches based on this year’s ladder (actual strength)
Clubs grouped by six, #7 gets much easier draw than #6 Toughness of draw scales with the strength of the team, no arbitrary blocks
Everyone gets a bye the week before the finals to discourage resting of star players Everyone gets a bye in the last five weeks before finals; the best teams get it later
Prime timeslots late in the season contain mismatches Schedule them when you know who is actually good
Proposed 6-6-6
Top six after 17 weeks guaranteed a home final Every position open until the last match
Local rivalries not played twice All rivalries played in the special Derby Round
The last five rounds have to be fixtured in a hurry There is an extra week during Derby Round, so you can take a couple of days to get it right
Home-Away balance not achievable unless all blocks have exactly three teams who have played 9 Home / 8 Away Every team gets 9 Home / 9 Away in the first 18, then 2 Home / 2 Away selected from unplayed return legs

And What Won’t it Solve?

Tanking
For that, use a more targeted points-based draft system
Some matches being more important than others
Any finals system is vulnerable to this. In the AFL, there are sharp divisions between 8 & 9, and between 4 & 5 that have huge rewards.
Some teams being crap
Mismatches will happen. There will be fewer under 17-D-4 because teams play their return matches against teams of similar strength

2016 Example

Let’s pretend that each team has played a single round-robin. In Round 18 (or Round 19 with the current counting for the early bye), each team plays its local rival. If they don’t have one, we’ll make them up for now. Clubs would have some say in this.

We assume that a good estimate of a team’s strength is the number of games it has won out of those 17. Looking at 2016’s ladder after 17 matches:

Team Won Points Target
Hawthorn 14 56 203
GWS 12 48 191
Sydney 12 48 191
Geelong 12 48 191
WC Eagles 12 48 191
Adelaide 12 48 191
W Bulldogs 12 48 191
North Melb 11 44 185
St Kilda 9 36 173
Port Adel 8 32 167
Melbourne 7 28 161
Collingwood 7 28 161
Richmond 7 28 161
Carlton 6 24 155
Gold Coast 6 24 155
Fremantle 3 12 137
Bris Lions 2 8 131
Essendon 1 4 125

That Target is the combined number of points that we want the team’s last five opponents to sum to — including their Derby rival. The average team has scored 34 points, so the average five-week schedule comes to 170 points. I’ve used a scaling factor of 1.5 to give stronger teams stronger opponents, but that number is malleable. Note: a perfectly fair draw would give the bottom teams a higher Target than the top teams, to account for self-reference. That would be a scaling factor of -1.0.

I’ve written a tree search program that finds close fits to the target totals, choosing matches from the return legs that have not yet been played. In the fixture below, every team is within 13 points of the target opponent strength (or an average of 2.6 per opponent, less than one win). For instance, Hawthorn’s opponents would be Geelong (already fixtured, 48) + West Coast (48) + Sydney (48) + Carlton (24) + St Kilda (36) for a total of 204, compared with a target of 203.

Team Target Actual Rival Other Opponents
Haw 203 204 Geel WCE, Syd, Carl, St.K
GWS 191 192 Syd Ess, N.M., W.B., WCE
Syd 191 204 GWS Geel, G.C., Melb, Haw
Geel 191 192 Haw B.L., P.A., Syd, Adel
WCE 191 192 Freo W.B., GWS, Rich, Haw
Adel 191 180 P.A. Geel, Rich, Coll, N.M.
W.B. 191 188 St.K P.A., GWS, G.C., WCE
N.M. 185 188 Melb Adel, Coll, St.K, GWS
St.K 173 164 W.B. Haw, N.M., Freo, Ess
P.A. 167 164 Adel B.L., Freo, Geel, W.B.
Melb 161 168 N.M. Carl, Syd, G.C., Rich
Coll 161 156 Carl Adel, Rich, Freo, N.M.
Rich 161 156 Ess Melb, WCE, Coll, Adel
Carl 155 144 Coll Haw, G.C., B.L., Melb
G.C. 155 156 B.L. Melb, W.B., Carl, Syd
Freo 137 148 WCE Coll, St.K, P.A., Ess
B.L. 131 132 G.C. Carl, Ess, P.A., Geel
Ess 125 132 Rich Freo, St.K, GWS, B.L.

We can then shuffle these 36 matches across five weeks, giving the top four a bye in the last round, and the next four a bye in the second-last round.

  1. Syd v Geel, WCE v GWS, G.C. v W.B., Carl v Haw, N.M. v Adel, P.A. v B.L., Freo v St.K, Rich v Melb (Ess, Coll byes)
  2. GWS v N.M., WCE v W.B., Haw v Syd, Geel v P.A., Adel v Rich, Ess v St.K, Freo v Coll (B.L., G.C., Carl, Melb byes)
  3. W.B. v GWS, Haw v WCE, Syd v G.C., B.L. v Ess, Adel v Geel, N.M. v Coll, Melb v Carl (Freo, P.A., St.K, Rich byes)
  4. St.K v Haw, Coll v Rich, GWS v Ess, Melb v Syd, Carl v G.C., P.A. v Freo, Geel v B.L. (Adel, WCE, W.B., N.M. byes)
  5. Rich v WCE, W.B. v P.A., Coll v Adel, St.K v N.M., G.C. v Melb, B.L. v Carl, Ess v Freo (Haw, GWS, Geel, Syd byes)

I noticed after I’d done this that I’d forgotten to enforce the constraint of Fremantle and West Coast not both playing at home in the same week, so I’ll leave that as an exercise for the reader.

Feedback welcome here and on Twitter.

A Simulation by Athletes

From the outside, Sport can be reasonably treated as a mathematical model, A Simulation By Athletes. But it cannot be taught this way. Expert knowledge from coaches and players is not built up from atoms of data, but top-down and augmented by experience.

At Ranking Software, we are looking to bridge the gap between the two approaches: assist coaches and experts with smarter ways of dealing with numerical information. We have to be aware that a sports result is a measurement that contains both skill and luck effects, and the latter is routinely underestimated.